Hacker Perspective: Computed Limit of Human Population
- Human population reached 8.0 billion in November 2022 (click: view current total; note
that humanity adds another billion every 11-12 years). But perhaps the effective total should include the sum of "number of humans" plus "beasts of burden" plus
"air-breathing machines".
Recall that an automobile consumes more O2 (oxygen) and energy in one hour than its owner would consume in 21 days. Also consider how much oxygen is consumed by the worldwide population of boats (cargo carriers, tankers, cruise liners), airplanes, locomotives, cruise liners, farm equipment, construction equipment, 18-wheelers, etc.
On a lesser note: (1) consider the nine carrier strike groups operated by the USA which include up to 70 other vessels each; (2) the number of SAC bombers that are continually flying; (3) the super yachts run by the world's millionaires and billionaires.
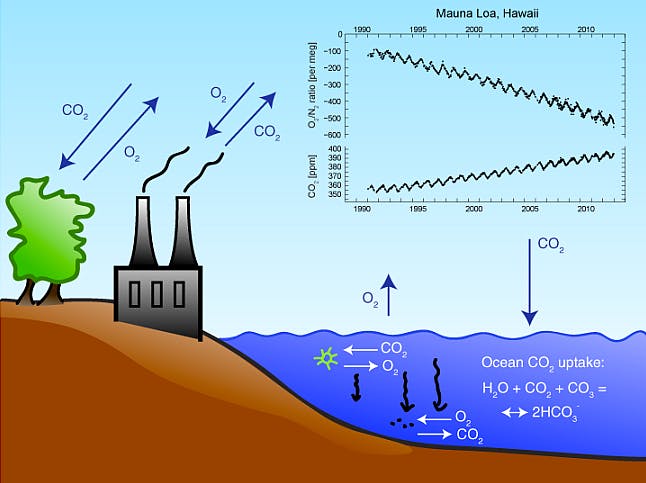
- Atmospheric O2 levels have been falling ever since scientists began continual measurements in 1990. This is because atmospheric O2 is combined
with C (carbon) to produce CO2 (carbon dioxide) during chemical combustion as well as animal respiration. Even though CCS (carbon capture and storage)
technology promises to reduce CO2 emissions by pumping CO2 underground, O2 levels will continue to fall due to burning.
- There simply isn't a sufficient amount of photosynthetic life on Earth to compensate for all the fossil fuels being burned by humanity.
Fact: Oceans, plants and animals emit about 780 gigatons of carbon annually and absorb nearly all of it. Human activities emit 29 gigatons of carbon per year but absorb almost none of it (so it ends up in the atmosphere). We can see this principle in action through the Keeling Curve which indicates a constant growth of atmospheric CO2 ever since measurements began in 1958. More update-to-date atmospheric measurements can be seen at NOAA. Did you notice the small "sine wave" oscillating on the rising line? This annual fluctuation in CO2 is caused by seasonal variations in "carbon dioxide uptake" by land plants. Since many more forests are concentrated in the Northern Hemisphere, more carbon dioxide is removed from the atmosphere during "Northern Hemisphere summer" than "Southern Hemisphere summer".
- Humanity is reproducing too quickly:
- Pick your preferred starting date before thinking about our current problem:
- Science provides these dates for your consideration:
- The current mammalian growth spurt begins 65 million years ago after an asteroid strikes Earth at Chicxulub causing the dinosaurs to become extinct.
- Anatomically modern humans first appear in the fossil record 250,000 years ago in Africa
- The current human growth spurt begins 11,700 years ago after the end of the ice age (estimated population: between 5 and 10 million)
- Abrahamic religions teach the world is ~ 6,000 years old (starting population: one mating pair)
- Science provides these dates for your consideration:
- Despite disease, war, and natural calamities, human population reached 1 billion in 1804. This required ~ 11,500 years (or ~ 5800 years)
- Despite disease, war, and natural calamities, human population reached 2 billion in 1930. This required an additional 126 years.
- Despite disease, war, and natural calamities, human population reached 6 billion in 1999. This required an additional 69 years. So, in 69 years, humanity repeated six times what required all history (before 1804) to only do once. Clearly, the current human population (which is still growing at a rate of 1 billion every 11-12 years) is too large and will soon outstrip planetary resources. Even if we destroyed all our machines and attempted to live like the Amish, there are still too many of us. In order to support the current population humanity will need to shift to non-combustible renewable energies.
- Clearly, Homo sapien has morphed into Homo technologicus
- Pick your preferred starting date before thinking about our current problem:
- Executive Summary
- This page began by "Thinking About Communicable Disease"
- Supporting Data
- Population Densities
- Population Videos
- Unit Conversions
- Loss of Biological Productivity
- C3 Photosynthesis (efficiency decreases as temperature increases)
- Further Research (C4 Photosynthesis and CAM)
- Flowering of Rice (is blocked at higher temperatures)
- Tree growth is slowed by heat

- Oceans Can't be Relied Upon to Pick Up the Slack
- Have We Already Passed the Tripping Point? (Maybe...)
- Parable of the Bacteria in a Bottle
- French Lily-Pond Riddle
- Video Lectures (To Learn More Details)
- Internal Links
- External Links
This page began "Thinking about Communicable Disease"
CAVEAT: the following effort was created before the COVID-19 pandemic. Numerous scientists said that a large pandemic was inevitable while most politicians ignored the warnings.
Influenza articles like these...
... tell us that the Influenza Pandemic of 1918 was triggered by soldiers living in close proximity during World War I. British medical archives tell us that an unknown disease (now known as The Flu) started in 1916 and then returned in 1917, 1918 and 1919. Apparently, diseases often reach pandemic proportions after three iterations.I started thinking that communicable disease would certainly exterminate all of humanity if we lived in similar proximity to World War I soldiers, and I wondered what that number would be. But all of humanity can't live like soldiers because we need (at the very minimum) to "set aside farm areas to provide us with food" and "industrial areas to provide us with clean water while processing our detritus". While it is true that tall buildings allow urban peoples to live more densely than field soldiers, human population will ultimately be limited by the area of land required to support life. And I wondered what that number would be.
Population-Limit Calculations (interactive chart)
Help:- click here to view today's total human population
- in the following form, YOU may update any yellow text boxes then click the CALCULATE button, to update blue boxes as well as the final table.
Conclusions:
- When you compare any two lines (e.g. "0.6 hectares" to "0.7 hectares") there does not seem to be a safe margin of error. All you would need is one bad agricultural
year to nudge humanity over the top.
- Many human societies require beasts-of-burden (horses, oxen, elephants) for farming and/or transportation. Each one of these larger animals requires agricultural land
to support their biological needs so the Maximum Supported Population tabled above should include the total of "humans and domesticated animals". In
this case humanity may have already exceeded Earth's resources.
- Not every society on the planet is using western agricultural techniques -AND- climate change is limiting agricultural productivity worldwide. I think it is safe to
say that some projections showing humanity successfully growing to nine billion are just a marketing fantasy. Eight billion may be out of the question
as well. If we ignore these risks, I am fairly certain that nature will produce some nasty diseases to limit our efforts. Perhaps the civilized thing to do is to accept
seven billion as an upper limit with the intention of shrinking back to six billion or lower.
- Work published by William Rees uses different numbers which require
urgent action.

- For example, his calculations state that the world average amount in 2007 was 2.1 global
hectares per person.
Quote: For 2007, humanity's total ecological footprint was estimated at 1.5 planet Earths; that is, humanity uses ecological services 1.5 times as quickly as Earth can renew them
NSR Calculations:- estimated population in 2007:
- population in 1999 was 6 billion.
- population grows ~ 83 million per year.
- total = 6 billion + ((2007-1999) * 83 million)
- total = 6 billion + 664 million.
- 6.664 billion.
- correction factor for unity (where 100% of Earth's resources can sustain humanity):
- 1 / 1.5 = 0.666
- target human population:
- 6.664 x 0.666 = 4.42 billion
- 6.664 x 0.666 = 4.42 billion
- estimated population in 2007:
- The typical U.K. citizen requires 4.9 global hectares per person.
- The typical American requires 8.0 global hectares per person.
- for everyone on the planet to have the same quality of living as an American, total population size must be reduced below one billion.
- Proceeding forward humanity must do one or more of the following right now:
- richer countries need to lower their standard of living.
- families need to reduce size.
- individuals need to delay reproduction.
- https://en.wikipedia.org/wiki/Ecological_footprint
- https://en.wikipedia.org/wiki/List_of_countries_by_ecological_footprint
- https://en.wikipedia.org/wiki/Ecological_services
- https://en.wikipedia.org/wiki/Global_hectare
- http://footprintnetwork.org/en/
- http://www.populationmatters.org (the population clock is unnerving)
- http://www.populationmatters.org/issues-solutions/environment/declining-biodiversity/living-planet-report/
- For example, his calculations state that the world average amount in 2007 was 2.1 global
hectares per person.
Supporting Data
Current Official Population Densities (2011-12-29)
This table provides a starting point for comparative purposes (note: I'm not sure if they are using total area or agriculturally usable area).
| Country | People per Square k/m |
People per Hectare |
Wolfram Calculator (estimates based upon 2010 data) |
|---|---|---|---|
| Canada | 3.73 | 0.037 | http://www.wolframalpha.com/input/?i=canada+population+density |
| USA | 33.7 | 0.337 | http://www.wolframalpha.com/input/?i=usa+population+density |
| China | 145 | 1.45 | http://www.wolframalpha.com/input/?i=china+population+density |
| India | 408 | 4.08 | http://www.wolframalpha.com/input/?i=india+population+density |
| Bangladesh | 1263 | 12.63 | http://www.wolframalpha.com/input/?i=bangladesh+population+density |
Videos (to learn more)
- title: Land Productivity Limiting Human Population
time: 13 min
link: http://www.khanacademy.org/video/land-productivity-limiting-human-population
Unit Conversions (and other stuff)
- http://www.onlineconversion.com
- http://www.metric-conversions.org
- http://chartsbin.com/view/wwu - Surface of the Earth (to verify my calculations)
- hover your mouse over the pie segments for additional information
- be sure to check out the segment Land that can be Farmed
- Hectare (metric system measurement of land area)
- Quote: a unit of area defined as 10,000 square meters (100 m by 100 m)
- Acre (imperial system measurement of land area)
- this article will convince you to permanently switch to the metric system
Caveats (prompted by a few emails I've already received about this web page)
- one square kilometer is equivalent to "one million square meters" (1,000 x 1,000 = 1,000,000)
- two square kilometers is only twice as much (2 million square meters)
- an area two kilometers square is equivalent to "four million square meters" (2,000 x 2,000 = 4,000,000)
caveat: this confusing colloquialism seems to be in decline (thankfully)
How large is one billion?
| Number | augmentative suffix | number of zeros | confusing alternate |
|---|---|---|---|
| 1,000 | thousand | 3 | |
| 1,000,000 | million | 6 | |
| 1,000,000,000 | billion | 9 | milliard |
| 1,000,000,000,000 | trillion | 12 | |
| 1,000,000,000,000,000 | 15 | billiard |
Loss of Biological Productivity
C3 Photosynthesis (efficiency drops as temperature rises)
- https://www.ipcc-wg2.gov/publications/SAR/SAR_Chapter%2013.pdf :: optimum ranges for photosynthesis in c3 and c4 plants
- http://ib.berkeley.edu/courses/ib151/IB151Lecture6.pdf :: Gross photosynthesis vs. Net photosynthesis
- This story on NPR's Science Friday radio program contained the following quote from Lester Brown:
- Read: http://www.sciencefriday.com/program/archives/201108122
- Listen: http://www.podtrac.com/pts/redirect.mp3/traffic.libsyn.com/sciencefriday/scifri20110812-hr1.mp3 then jump to 15 minutes 20 seconds
- quote (also found on p47 of his book "World On the Edge"):
Crop ecologists use a rule of thumb that for each degree Celsius increase in temperature above the optimum during the growing season, we can expect a 10-percent decline in grain yields (note: 1 C = 1.8 F)
- http://www.windows2universe.org/earth/climate/crops_withering.html
- Quote: How do plants deal with increases in temperature? During the process of transpiration, plants lose water through tiny holes in their leaves called stomata. Because the water evaporates from the surface of the leaf, transpiration helps plants stay cool, in the same way sweating keeps humans cool. So the process of plants losing water through their stomata prevents overheating of the plant. Global warming is also projected to bring less precipitation or increased drought conditions in many parts of the world. How do plants deal with a lack of water? When less water from the soil is available, the plant closes the stomata on its leaves so water doesn't escape from the plant. Unfortunately, closed stomata don't let in carbon dioxide (CO2) needed for photosynthesis and plant growth becomes stunted. The plant must now choose between keeping its own water (stomata closed) and gaining food through photosynthesis (stomata open). At the point when the plant cannot survive any more without food, it will be forced to open its stomata, letting its own water escape. The plant, which is fighting to survive, becomes wilted or withered.
- http://www.agriculture.purdue.edu/AgAnswers/story.asp?storyID=5992
- Quote: Daytime temperatures up to 86 F are beneficial for corn plant photosynthesis. Anything above 86 F for a sustained amount of time can foster disease development, cause stress during grain fill and exacerbate ear rots
-
http://www.rea-hybrids.com/assets/files/agronomy/Ag_Spotlight-High_Night-Time_Temps_and_Stalk_Cannibalization.pdf
- Quote: for each 13 F increase in [night-time] temperature, respiration rates may double. During this time the plant is using more of the sugars produced by photosynthesis for its own maintenance instead of growth
- Search: https://www.google.ca/?gws_rd=ssl#q=%22optimal+temperature%22+%22agricultural+productivity%22
Further Research (C4 Photosynthesis and CAM)
-
My Interim Summary:
- Many online articles seem to confuse and/or contradict each other. Putting what I have read so far into technical terms:
- All plants employ the Calvin cycle (a.k.a. Calvin–Benson-Bassham cycle)
- C3 plants employ the simplest photosynthesis processing design and make up 85% of all the plants on Earth
- C4 plants build on the C3 design by employing a chemical pre-processor as a front-end to the Calvin cycle.
- CAM plants build on the C4 design by doing additional molecular pre-processing (like inhaling CO2) only at night.
- supporting Wikipedia articles:
- The 10-percent-per-degree drop in photosynthesis (see above table) appears to apply only to C3 plants like wheat, rice, barley and oats. But there is a catch...
- Photosynthesis in C4 plants like maize (corn), sugarcane, sorghum, and amaranth, operates at a
fairly constant level until the temperature hits the limit value (still 86 F for corn) when the whole process abruptly halts. There is no magic here and these
plants can still wilt if the temperature stays too high for too long of a period.
quote from: http://www.agriculture.purdue.edu/AgAnswers/story.asp?storyID=5992
Daytime temperatures up to 86 F are beneficial for corn plant photosynthesis. Anything above 86 F for a sustained amount of time can foster disease development, cause stress during grainfill and exacerbate ear rots [snip] High daytime temperatures can result in corn plants having lower net photosynthetic energy and fewer sugars available for corn kernel development. When nighttime temperatures also are high, corn plants expend more sugars gained during daylight hours on nighttime maintenance respiration. Ideal nighttime temperatures during grainfill range between 60-65 F.
- CAM plants, like pineapple and cactus, have adapted to higher temperatures but appear to grow slower (would it be accurate to suggest "more cautiously?"). For example, pineapple plants only flower every two years.
- As far as agricultural productivity is concerned, C3 plants outperform C4 plants at normal temperatures. C4 plants have an additional front-end processor which requires additional energy to operate. (what was that old adage about "no free lunch"?)
- Many online articles seem to confuse and/or contradict each other. Putting what I have read so far into technical terms:
- http://hyperphysics.phy-astr.gsu.edu/hbase/biology/phoc.html
- Quote: Plants which use only the Calvin cycle for fixing the carbon dioxide from the air are known as C3 plants. In the first step of the cycle CO2 reacts with RuBP to produce two 3-carbon molecules of 3-phosphoglyceric acid (3-PGA). This is the origin of the designation C3 or C3 in the literature for the cycle and for the plants that use this cycle. [snip] About 85% of plant species are C3 plants. They include the cereal grains: wheat, rice, barley, and oats. Peanuts, cotton, sugar beets, tobacco, spinach, soybeans, and most trees are C3 plants. Most lawn grasses such as rye and fescue are C3 plants. C3 plants have the disadvantage that in hot dry conditions their photosynthetic efficiency suffers because of a process called photorespiration. When the CO2 concentration in the chloroplasts drops below about 50 ppm, the catalyst RuBisCO that helps to fix carbon begins to fix oxygen instead. This is highly wasteful of the energy that has been collected from the light, and causes the RuBisCO to operate at perhaps a quarter of its maximal rate. The problem of photorespiration is overcome in C4 plants by a two-stage strategy that keeps "CO2 high" and "oxygen low" in the chloroplast where the Calvin cycle operates. The class of plants called C3-C4 intermediates and the CAM plants also have better strategies than C3 plants for the avoidance of photorespiration.
- C4 examples: corn, sorghum, sugarcane and millet
- http://biology-pages.info/P/Photosynthesis_history.html
- http://openwetware.org/images/f/f3/PLB_316_C3_C4_1-31-11.pdf
- http://www.ibiblio.org/ecolandtech/agriculture/general/1/msg00039.html
- Quote: Maize (corn to the Yanks) to the rest of the world, is a C4 grass. The C3 and C4 compounds aren't really all that important, but any introductory plant physiology text will explain it. The significant fact about C4 plants is that they are designed to grow in some pretty nasty climates. C4 metabolism, coupled with Crassulacean Acid Metabolism (CAM), allows growth in deserts, on mountains, tundra, etc. The poor C3 plants must necessarily capture and subsequently incorporate their CO2 while the sun shines, so they open their pores to get the CO2 during the day; the heat and wind dries them out and they die. Those clever C4 plants, however, open their pores at night and capture the CO2 when the air is cooler, so they won't dry out. The next day (with pores closed), they use the light to incorporate the CO2. C4 metabolism is a more expensive [energy-consuming] physiological process than the C3 metabolism, but it allows the C4 plant to capture more CO2 overall than C3 plants. If you put a C4 (corn) in a sealed chamber with a C3 (potato), the C4 will suck up all the CO2, and the C3 plant will wither and die.
World Losses in Productivity (is it one degree Fahrenheit or Celsius?)
I have always been looking for publications which would say that an overall 10% loss is due to an increase of one degree Fahrenheit or one degree Celsius but have had no luck to date.
Considering all these points:
- The C3 Photosynthesis Table above was published using degrees Fahrenheit
- In a warming world, some bands of C3 agriculture may shift a little farther north in the north (or a little farther south in the south) where they will encounter more warmth but less sunlight.
- C4 plants are able to survive slightly higher temperatures
- C4 agriculture may be impractical or impossible to introduce intro areas just vacated by C3 farms (if pineapple farms were practical in the American south or south-west then wouldn't we already have seen them)
- Algae performs a lot of photosynthesis in the oceans
I am going to speculate that Celsius is correct figure when considering world-wide losses in biological productivity.
Flowering of Rice (blocked at high temperatures)
- https://risocas.uni-hohenheim.de/uploads/media/mb_00156.pdf
- Quote: High percentages of spikelet sterility occur if temperatures exceed 35�C at anthesis (the maturing of the stamens) and last for more than 1 hour
- https://en.wikipedia.org/wiki/Climate_change_and_agriculture
- http://www.scribd.com/doc/49671625/AGRICULTURE-IN-A-TIME-OF-CLIMATE-CHANGE
- Quote: Rice becomes sterile if exposed to temperatures above 35 degrees for more than one hour during flowering and consequently produces no grain
- http://ci.nii.ac.jp/naid/110001720734
- Quote: The objectives of this study are to compare the floret sterility induced by a high temperature given in the daytime during the flowering period among nine japonica rice varieties, and to clarify the mechanism of the high-temperature-induced sterility. Nine japonica rice varieties were subjected to 35.0, 37.5 or 40.0 degree C day- temperature conditions (1000-1600) for six consecutive days using sun-lit phytotrons, and the percentage of fertility, pollination and germinated pollen grains on the stigmas were examined. The temperature that caused 50% sterility varied with the variety, and a difference of approximately 3.0 degree C was observed between the most tolerant and susceptible varieties. Under the 37.5 degree C day-temperature condition, the percentage of florets with 10 or more germinated pollen grains was roughly coincident with the percent fertility, but under the 40 degree C day-temperature condition, it was higher than the percent fertility. Many of the florets with less than 10 germinated pollen grains had less than 20 total pollen grains on their stigmas under both temperature conditions. From these results, we concluded that sure pollination under high-temperature conditions is an important factor and that the high-temperature tolerance of the processes following pollen germination is also required for fertility under excessively high temperature conditions.
- http://aob.oxfordjournals.org/content/89/6/683.full
- Quote: Rice is grown mainly in tropical and subtropical zones, and a high temperature at flowering can induce floret sterility and can limit grain yield. Since the 1980s, an increase in the concentration of greenhouse gases, such as carbon dioxide, in the atmosphere is thought to have been responsible for increasing the air temperature. Amongst other things, global warming is expected to result in the occurrence of high temperature induced floret sterility in rice.
Tree growth is slowed by heat
- the idea for this section was inspired by material on page 39 of issue 28-January-2012 of New Scientist Magazine
- http://www.newscientist.com/article/mg21328491.800-big-trees-in-trouble-how-the-mighty-are-falling.html
- Key points:
- all plants, including trees, employ both photosynthesis and respiration.
- photosynthesis collects energy by converting sunlight, water (H2O) and oxygen (O2) into glucose (C6H12O6)
- respiration reverses the process by extracting energy from glucose by burning it with oxygen. Just as is animals, this chemical process takes place in cell organelles known as mitochondria. This energy is used for both maintenance and growth.
- tree canopies retain moisture to enable leaf temperatures to remain cooler than ambient air temperature (see the chart above showing the optimum average temperature for photosynthesis being 76 F or 24.4 C). Believe it or not, this canopy is actively moisturized by trees engaging in transpiration (when sufficient water is available).
- when leaf temperatures get too hot, leaves close their stomata in order to conserve moisture. At this point, photosynthesis stops but respiration continues.
- respiration also continues at night when photosynthesis is not possible.
- the amount of respiration (day or night) is proportional to the ambient temperature.
- The highest amounts of respiration occur during the day
- Warm nights mean more respiration (consumes more glucose and oxygen).
- Cool nights mean less respiration (consumes less glucose and oxygen).
- Cold-to-frozen nights mean no respiration (dormant)
- When not in a dormant phase...
- a tree will only grow when energy requirements (respiration) are lower than energy collection (photosynthesis)
- a tree will not grow when energy requirements (respiration) closely match energy collection (photosynthesis)
- a tree will die when energy requirements (respiration) are not equaled by energy collection (photosynthesis).
- For a short time, a healthy tree...
- with sufficient resources might grow more leaves (to increase energy collection)
- with insufficient resources might drop leaves (to drop energy requirements)
- For a short time, a healthy tree...
- all plants, including trees, employ both photosynthesis and respiration.
- To learn more:
- http://mff.dsisd.net/Environment/TreePhys.htm#Photosynthesis%20and%20Respiration
- http://www.insights.co.nz/magic_habitat_htw.aspx
- The "10% rule of thumb" Plants are able to "fix" about 10% of the solar energy that reaches plant surfaces (usually less,
however). "Fixing" means converting solar energy into chemical energy (sugars). Organisms that consume plants, are able to extract about 10% of the energy stored in
the plant. Organisms that consume other consumers can extract only about 10% of the energy stored in their prey. These levels of energy consumption are called
"trophic levels." Energy flow through an ecosystem (large or small) is a key life process. Threads of energy transfer are called "food chains." Food chains also
include the transfer of chemicals other than sugar. Many nutrients, amino acids, and other compounds are digested and recombined by consumers along any particular
food chain.
So what does this mean for trees?- A healthy plant requires ten times more energy to grow properly than it does to maintain its life while under stress but not dormant.
- Humans don't eat trees but if humans want to rely upon trees to clean up the atmosphere (increase oxygen via photolysis; decrease carbon-dioxide via photosynthesis) then each person on the planet had better plant (and maintain) ten trees. Obviously, a family of four requires forty.
Oceans cannot be relied upon to pick up the slack.
- Just like a warming beer begins to fizz, warming oceans release their dissolved gases including oxygen (there is more oxygen found in cold water which is why the best
trout and salmon come from polar waters) and CO2. This is an indication that warming oceans will be far less productive in the future.
Don't believe me?- Since Jellyfish are able to out-compete other species in oxygen-poor water (probably reminds them of environmental conditions 550 million years ago), they are
increasingly a large proportion of biomass netted (and thrown back) by Japanese fishermen. Believe it or not, the amount netted is related to the lunar cycle.
- http://www.eurocbc.org/page727.html - Jellyfish “blooms” could be sign of ailing seas.
- http://www.perdidokeyassociation.org/jellyfish_blooms.htm - Jellyfish “blooms” - signs of ailing seas
- After movies like Jaws and Anaconda people have a newfound respect for sharks and snakes. But it turns out that Box Jellyfish (Irukandji) kill more humans each year than all the other animals combined. On top of this fact, the death is usually misdiagnosed as either a heart attack or stroke which means that the official recorded death statistic is way too low.
- Since Jellyfish are able to out-compete other species in oxygen-poor water (probably reminds them of environmental conditions 550 million years ago), they are
increasingly a large proportion of biomass netted (and thrown back) by Japanese fishermen. Believe it or not, the amount netted is related to the lunar cycle.
- Ocean levels are rising. The question here is this: are levels due to melting polar ice or the thermal expansion of water? Many scientists say it is about
half-and-half.
- http://sealevel.colorado.edu/
- current rate is ~ 3.2 mm/year since 1993.
- https://en.wikipedia.org/wiki/Current_sea_level_rise
- http://www.windows2universe.org/earth/climate/cli_sea_level.html
- 20-cm (8-inches) since 1910.
- Personal Comment: This chart has no "hockey stick" so I do not see how anyone can not conclude that this growth won't continue.
- http://www.cmar.csiro.au/sealevel/sl_hist_intro.html#fewthousand
- chart shows ocean levels begin to rise shortly after humanity began burning petroleum while beginning exponential population growth
- http://www.windows2universe.org/earth/climate/cli_effects.html
- http://sealevel.colorado.edu/
Have We Already Passed the Tripping Point? Maybe.
Talking Point #1

Some people tell me "humanity has nothing to worry about because CO2 is good for plants". Supposing that this statement is not a naive over simplification then we must ask: when can we expect plants to react to the excess CO2? Referring to the Keeling Curve for a moment, it looks like CO2 has been on a constant rise ever since Charles Keeling started taking official measurements in Hawaii starting in 1958. The rising line looks fairly straight and you would have thought we might see the results of an explosion of plant life to compensate for all the additional CO2. More update-to-date atmospheric measurements, charts, and datasets can be retrieved from NOAA's GMD (global monitoring division) site. Raw data in csv format (can be imported into MS-EXCEL) can be retrieved here: http://scrippso2.ucsd.edu/cosub2sub-data
| year | CO2 | 1958 reference |
comments |
|---|---|---|---|
| 2011 | 391 | 315 | 24% increase over 53 years |
| 2019 | 410 | 315 | 30% increase over 61 years |
Perhaps higher atmospheric temperatures (due to higher CO2 levels) are preventing plant life (at least C3 plant life) from exploding into the role of "environmental savior" because the atmospheric temperature chart seems to have grown continually since 1878 when the International Meteorological Society began daily world-wide measurements. One thing that is certain is this: additional deforestation by humans probably hasn't helped. Especially if it was done by slash-and-burn techniques.
Talking Point #2
Some people tell me "higher levels of CO2 will force plants to grow". This is a gross oversimplification for the following two reasons:
- Almost all biological systems are pull-based rather than push-based. For example, a human body-builder will lift weights to force his body to "require" more dietary protein. This causes an increased amount of dietary protein to be pulled into the body from the digestive system which, if you think about it, is really outside the body but I digress. Attempting to push-in nutrients does not induce muscle growth (but a lack of it will be a problem if not enough is present when required).
- A primary grade school explanation of photosynthesis tells the young student that "CO2 is converted into O2". Sometimes a
very simplified chemical formula is provided like this one:
CO2 + H20 + energy = (CH2O) + O2
- Secondary-school biology classes introduce more details including a properly balanced chemical formula similar to this one:
6CO2 + 6H2O + photons = C6H12O6 + 6O2
- College courses in molecular biology fill in the missing intermediate steps which show that O2
is only liberated by the photolysis of water (the original research was done using radioactive tagging). So rather than saying: During
photosynthesis, "CO2 is converted into O2" it is more accurate to say "H2O is split by photolysis into
O2 and H with the O2 discarded to the atmosphere; later in the process, H is combined with atmospheric CO2
to produce glucose"
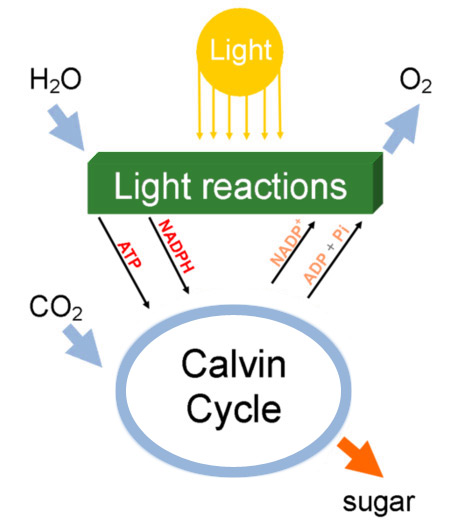
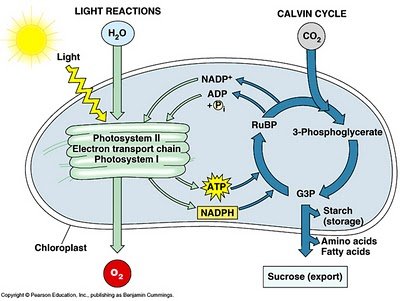
So we now know that sunlight (input 1) and H20 (input 2) are more important than CO2 (input 3) because the photolysis of water in Photosystem II (on the left-hand side of the diagram) powers the Calvin Cycle (on the right-hand side of this diagram). We already know that too much sunlight, or too much water, will kill a plant so pushing in additional carbon-dioxide makes little sense (but each ingredient is considered a limiting factor to maximum productivity). But because increasing atmospheric CO2 is driving up atmospheric temperatures, we can expect increased evaporation. This will result in less bio-available water to plants.
A few more details - The left-hand side of the diagram was previously known as The Light Reactions but most publications this side of Y2K refer to it as
Light-dependent Reactions
- Light induces photolysis (splitting of water into hydrogen and oxygen) which liberates an electron along with a small amount of energy to power
other chemical reactions (see: electron transport chain for details)
- one liberated electron is used to bind phosphorous (+P) with ADP yielding ATP (the power transfer molecule of most biological systems including humans)
- energy is used to bind atomic hydrogen (H) to NADP+ yielding NADPH (to transport hydrogen to the other side of the diagram)
- some energy is used to bind atomic oxygen (O) into molecular oxygen (O2) which is released to the atmosphere
- observation: You might wonder why Photosystem II is before Photosystem I. These labels
relate to the order in which they were discovered and were not changed because this would conflict with previously published literature.
- Light induces photolysis (splitting of water into hydrogen and oxygen) which liberates an electron along with a small amount of energy to power
other chemical reactions (see: electron transport chain for details)
- The right-hand side of the diagram was previously known as The Dark Reactions but most publications this side of Y2K refer to it as Light-independent Reactions
- hydrogen (from NADPH) is combined with atmospheric CO2 to produce glucose
- the whole thing is powered by converting ATP back into ADP (which frees a +P to be used in the next turn if the cycle)
Speculation: to avoid a CO2 run-away effect, humanity may need to engage in world-wide terraforming of Earth just to get the rising CO2 problem under control. Fat-cat business men will try to make a buck out of this crisis but this might be something that everyone on Earth will be pressed into to doing just to save humanity and human culture (which Earth's biosphere couldn't care less about) - The left-hand side of the diagram was previously known as The Light Reactions but most publications this side of Y2K refer to it as
Light-dependent Reactions
Talking Point #3 - Fact: Atmospheric Oxygen is Falling
I recently stumbled onto this article at John Cook's Skeptical Science site which states "Atmospheric O2 (oxygen) is decreasing by the same amount that CO2 (carbon dioxide) is increasing".
Googling this phrase: atmospheric oxygen depletion
yields documents like these:
- https://cdiac.ess-dive.lbl.gov/trends/oxygen/modern_records.html
- http://scrippso2.ucsd.edu/
- https://www.ncbi.nlm.nih.gov/pmc/articles/PMC5138252/
Yikes! I think I made a fairly strong case at the top of this page for the area of farmland being the main limiting factor to the human population but it now looks like humanity is using more oxygen than is being replenished by photosynthesis.
The article also states "Atmospheric Oxygen is so abundant at about 20.9% (209,500 parts per million or ppm) that we are in no danger of running out". But I think we need to realize that our planet has "turned a corner" which means humanity cannot continue previous behavior.
While it is true that 7 billion humans are busy inhaling O2 and exhaling CO2, no one has mentioned the elephant in the room: automobiles. Like large animals engaged in respiration, automobiles (which experts number at slightly over 1 billion) are responsible for a large amount (perhaps 20%) of O2 being converted in CO2. Really large machines like locomotives, tankers, cruise ships, and jet air craft, consume way more O2 than a car, but there are far fewer of them compared to automobiles. So at the very least, the automobile population needs to be included when computing the maximum population of human and large animals at the top of this page. We all know that humanity has no intention of giving up personal transportation so I think I have just convinced myself of the need for electric cars powered by renewable energy from hydrological, wind and solar technologies.
- "ppm" vs. "per meg"
- Some scientists still do not understand that some unnecessarily complicated data presentations will only confuse the layman while fueling the arguments of conspiracy theorists and climate-change deniers. Such is the case with some of the IPCC charts which mix two units ("ppm" and "per meg") on one graph.
- "ppm"
- Represents "parts per million" but this label is somewhat ambiguous since it assumes volume rather than mass (weight). Modern scientific texts (this side of y2k) explicitly use the phrase ppmv (parts per million volume)
- "per meg"
- In the mid-1980s, the Scripps Institute pumped atmospheric samples into tanks to act as a future reference sample. Each year they make new
measurements then compare the ratio of oxygen to nitrogen between the two. They did it this way because if lab equipment was modified in any way
then both current and reference samples would be treated identically each measurement cycle.
- http://scrippso2.ucsd.edu/ <--- shocking charts
- http://scrippso2.ucsd.edu/faq
- question: how-does-one-relate-ppm-and-meg-units?
- question: why-not-use-ppm-units-for-o2?
- In the mid-1980s, the Scripps Institute pumped atmospheric samples into tanks to act as a future reference sample. Each year they make new
measurements then compare the ratio of oxygen to nitrogen between the two. They did it this way because if lab equipment was modified in any way
then both current and reference samples would be treated identically each measurement cycle.
- Some scientists have published alternate material claiming that when fossil fuels are burned, 3 molecules of Oxygen are lost for every increase in Carbon Dioxide
- http://blogcritics.org/scitech/article/atmospheric-oxygen-levels-fall-as-carbon/
Quote: It is roughly true that the oxygen depletion is equivalent to a displacement by carbon dioxide. But it is not exactly true. First, some of the carbon dioxide produced has been absorbed by the oceans. This process involves inorganic chemical reactions which have no effect on O2. Second, the O2:C combustion ratio of a fossil-fuel depends on the hydrogen content. The ratio varies from about 1.2 for coal, 1.45 for liquid fuels, and 2.0 for natural gas. Taking these factors together, we are losing nearly three O2 molecules for each CO2 molecule that accumulates in the air.
Quote: Since the beginning of the industrial revolution we have removed .095% of the oxygen in our atmosphere. True, that is only a tenth of one percent of the total supply, but oxygen makes up only 20% of the atmosphere.
- http://blogcritics.org/scitech/article/atmospheric-oxygen-levels-fall-as-carbon/
Parable of the Bacteria in a Bottle
Developed by Al Bartlett, professor of physics at University of ColoradoThe Set-up
- 11:00
- You place a single bacterium in a nutrient-filled bottle at 11:00 am. It grows and divides into two bacteria at 11:01. These two bacteria each grow and divide into 4 bacteria at 11:02, which grow and divide into 8 bacteria at 11:03, and so on. (i.e., doubling time of 1 minute.)
- 12:00
- Bottle is full, nutrients gone, all the bacteria die.
- When was the bottle half-full?
Hover Mouse Here to View Answer:
The bottle was half full at 11:59 - You are a mathematically-sophisticated bacterium, and at 11:56 you recognize the impending disaster. You immediately jump on your soapbox and warn that unless your
fellow bacteria slow their growth dramatically, the end is just four minutes away. Will anyone believe you?
Hover Mouse Here to View Answer:
At 11:56, the bottle would be 1/16th full. Of course no one will believe you. - Just before disaster strikes… a bacterial space program discovers three more bottles in the lab. With a population redistribution program, how much time do the 3 new
bottles buy the colony?
Hover Mouse Here to View Answer:
More than 1 minute, less than 2 minutes. FYI: The volume of bacteria would exceed the volume of observable universe in about 5 1/2 hours.
NSR Comments:
- How does this apply to humanity?
- Despite the negative effects from two world wars and numerous pandemics including HIV AIDS and Ebola, human population quadrupled between 1900 (1.5 billion) and 1999 (6.0 billion). Our current growth rate is approximately one billion for every 12 years. We passed 7-billion in December, 2011, and will probably reach 8-billion sometime in 2023. While it is true that the growth rate as a percentage is falling, an additional billion every 12 years is still constant growth, and humanity is courting disaster.
- When human populations in Europe grew too large, nature cooked up diseases like Typhus, Cholera, and the Bubonic Plague to limit our numbers (some estimate that communicable disease wiped out between 25% and 75% of the European population over a 500 year period). If human population continues to rise, compromised immune systems (due to poor nutrition), will enable a deadly repeat of what we've experienced previously.
- Politicians and Economists don't seem to understand that constant growth (of even a percent or two) is not possible.
- The only other life-form on Earth which attempts to continually grow is cancer although rodent populations come a close second.
- If humanity follows this course then we are no better than a disease on this planet attempting to out strip our resources.
- I am convinced that the Earth does not need us. Human civilization could be totally wiped out and the Earth would not care in anyway. But don't worry, humanity can probably rely upon humans living in Polynesia to reboot civilization all over again (although it may require another 11,700 years).
- Think twice about all this stuff the next time you hear anyone criticizing the government for poor GDP (gross domestic product) or GNP (gross national product) numbers.
- Engineers would most likely advise humanity to move from a "growth-model" to a "steady-state model".
French Lily Pond Riddle
This story is told to French school children to impart the power of exponential growth
- One lily pad in a pond
- The next day it doubles: two lily pads
- The next day it doubles: four lily pads
- The next day it doubles: eight lily pads
- After 29 days, the pond is half filled
- One day later, the pond is full
NSR Comment:
- It required all of our history for humanity to reach 1.5 billion in 1900.
- It only required 99 years for humanity to reach 6.0 billion in 1999.
- So is humanity at step 5 of the lily-pond riddle, or step 6?
Video Lectures (to Learn More Details)
Free 10-minute video lectures from Khan Academy
A refresher on cellular respiration
Internal Links
External Links
- http://www.paulchefurka.ca/Population.html
- http://footprintnetwork.org/en/
- http://www.populationmatters.org (the population clock is unnerving)
- http://www.populationmatters.org/issues-solutions/environment/declining-biodiversity/living-planet-report/
Assertion: One U.S. Gallon of Gasoline meets the energy requirements of one human for 21 days
- http://powershift.anetce.com/oil_humanenergy.htm
- additionally
facts 1 Gallon of Gas = 125,000 BTUs Source: US Department of Energy 3,400 BTUs = 1 KWH Source: US Department of Energy, Bonneville Power Mgt. 1 Gallon of Gas = 37 KWH 125,000 BTUs in a gallon of gas divided by 3,400 BTUs in 1 KWH Human work output in agriculture = 0.1 HP or 0.074 KW calculation 37 / 0.74 = 500 1 Gallon of Gas = 500 hours of human work output 37 KWH in 1 gallon of gas divided by human work output in agriculture of .074 KW = 500 500 / 24 = 20.8 days
 Back to Home
Neil Rieck
Waterloo, Ontario, Canada.